Profiling Django views with Scooby profiler
Earlier in 2016, I came up with the idea of creating a Python module which could provide functionality of profiling functions w.r.t. SQL queries and tell exactly at what lines of function, the queries were happening. I called that package Goofy and created it with the engineering of Python AST manipulation. You can read the post on it here later. It helped us profiling views serving AJAX requests but it had some limitations too. E.g. we couldn’t see the whole callstack trace of the queries and couldn’t analyze the queries.
In an internal hackathon @HackerEarth which happened in Nov 2017, I revisited this problem and tried to come up with a profiler, through which we could see the stats on front-end and which should be much lightweight and would work with AJAX requests. I named this package Scooby.
Idea
We have been using the package django-debug-toolbar, but it wasn’t enough because it didn’t have the functionality of profiling AJAX requests. And because of the size of our codebase, it had made serving web pages slower in develop mode because it injects the stats in HTML by rendering and rendering takes time. So we needed an alternative.
The idea while creating the Scooby package was to have a similar type of package as of django-debug-toolbar but instead of rendering the stats to HTML, we can dump the stats data to some backend store e.g. Redis where it will reside temporarily. And show the stats on front-end using a chrome extension.
Implementation
We had to create a Python/Django package for backend and a npm package for front-end which would build the chrome-extension. We took the decision of using ReactJS as rendering framework for the chrome-extension.
In backend, we just had to create and put a new middleware which will do the job of collecting
profiled stats for different plugins (E.g. SQL, Memcache etc.) and put
the stats to Redis against some UUID as key. We would put that key as value of a
custom header (X-Scooby) in HTTP response, so that chrome-extension could collect stats for
that request-response later using that key.
The chrome-extension would put a hook to network calls in browser and
whenever a response comes for a request, check if the
response has that custom header which contains the UUID. If yes, then collect
the data from url /scooby/get-data/<uuid>/ in same domain.
This is the code of middleware (You can skip directly to Further improvements section if you are not interested in code):
import uuid

from .base import ScoobyData
from .utils import get_redis


class ScoobyMiddleware(object):
    def process_request(self, request):
        request.scooby_data = ScoobyData()
        request.scooby_data.on_process_request(request)

    def process_view(self, request, view, view_args, view_kwargs):
        request.scooby_data.on_process_view(
            request, view, view_args, view_kwargs)

    def process_response(self, request, response):
        request.scooby_data.on_process_response(request, response)
        unique_hex = uuid.uuid4().hex
        response['X-Scooby'] = unique_hex
        # Set data in redis for 10 minutes.
        redis = get_redis()
        redis.set(unique_hex, request.scooby_data.as_json(), 600)
        return response
And this is how ScoobyData class is defined. For each stage of middleware
(process_request, process_view and process_response),
it deferred to all available plugins so that those could collect their respective data on their own.
import json

from .plugin_finder import get_plugins

class ScoobyData(object):
    def __init__(self):
        self.plugins = get_plugins() # Instances of different plugin classes.
        self.plugins_data = {}
        for plugin in self.plugins:
            self.plugins_data[plugin.name] = plugin.Data()

    def on_process_request(self, request):
        for plugin in self.plugins:
            plugin_data = self.plugins_data[plugin.name]
            plugin.on_process_request(plugin_data, request)

    def on_process_view(self, request, view, view_args, view_kwargs):
        for plugin in self.plugins:
            plugin_data = self.plugins_data[plugin.name]
            plugin.on_process_view(plugin_data, request,
                                   view, view_args, view_kwargs)

    def on_process_response(self, request, response):
        for plugin in self.plugins:
            plugin_data = self.plugins_data[plugin.name]
            plugin.on_process_response(plugin_data, request, response)

    def as_json(self):
        plugins_data_json = {}
        for plugin_name in self.plugins_data:
            plugin_data = self.plugins_data[plugin_name]
            plugins_data_json[plugin_name] = plugin_data.as_json_dict()
        return json.dumps({
            'plugins_data': plugins_data_json
        })
Here is the code of a very simple plugin which would collect data regarding
which view was hit and what all args and kwargs were passed to it:
class ViewNamePluginData(object):
    def __init__(self):
        self.view_name = None
        self.args = ()
        self.kwargs = {}

    def as_json_dict(self):
        return {
            'view_name': self.view_name,
            'args': self.args,
            'kwargs': self.kwargs,
        }

class ViewNamePlugin(object):
    Data = ViewNamePluginData

    def __init__(self):
        self.name = 'ViewName'

    def on_process_request(self, request):
        pass

    def on_process_view(self, plugin_data, request,
                        view, view_args, view_kwargs):
        plugin_data.view_name = '%s.%s' % (view.__module__, view.__name__)
        plugin_data.args = view_args
        plugin_data.kwargs = view_kwargs

    def on_process_response(self, request, response):
        pass
This has been the generic way of adding new plugins, and collecting/serving data regarding those plugins. We added the plugin for SQL queries with same pattern.
Further improvements
After this was build in hackathon, there have been many additions to this package later on.
- We added the plugins for queries happening in Memcache and Thriftpy along with SQL.
- Added a plugin for raw Python cProfiler using which you could cProfile your views with just enabling it in chrome-extension. You don’t need to put temporary code for cProfiling views anymore.
- Added the option to enable profiling on front-end instead of always collecting/dumping data on backend. This way there is no overhead of this profiler on backend when you are not using the chrome-extension.
- Added a logger with scooby package too which would behave
alternative to
print/logger.debugfor debugging purposes. With this new logger you wouldn’t have to look into console but instead look into the chrome extension in browser for those logs. Here’s how you can do that:
import scooby
scooby.log("foo", "bar")
Screenshot
Here is the screenshot of how SQL queries look in chrome-extension.
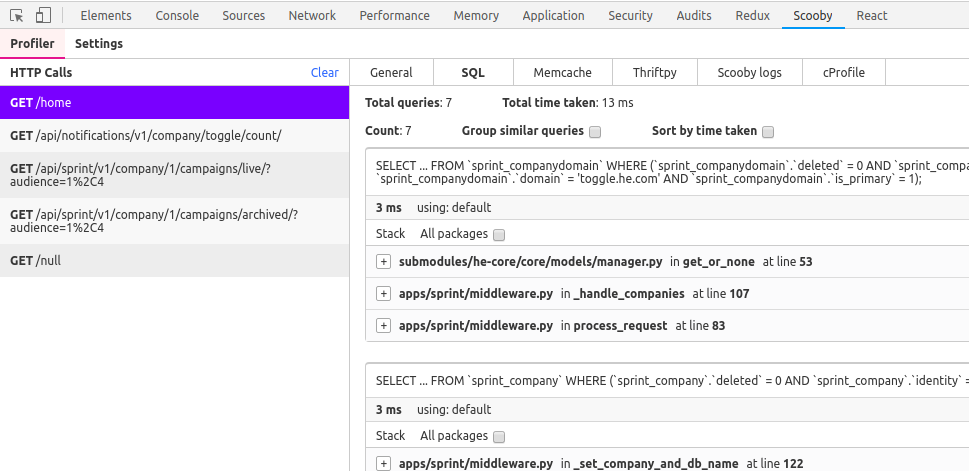
In the right panel under SQL tab, you can see stacktraces of all different queries. There is an option to group all similar queries together. Let’s say if you are making same type of sql query in a for loop, just few parameters are changed in different queries. By grouping them together you can see the count of those and also see how much total time those took. By this, N+1 query proplems are analyzed.
Open sourcing it
Both backend and front-end packages of Scooby profiler are open-sourced.
If you are using Django as the backend framework, give this profiler a try. We would be glad to hear the feedback.
- The Python package is available in PYPI as name of
django-scooby-profiler. This is the github link https://github.com/shhaumb/django-scooby-profiler. That page contains the documentation of how you can integrate it with your project. - The chome extension is available in chrome web store https://chrome.google.com/webstore/detail/scooby-profiler/kicgfdanpohconjegfkojbpceodecjad.
Posted by Shubham Jain. You can follow me on Github and Twitter.