The HackerEarth Data Challenge
40,000+ programmers use HackerEarth. Everyday, people from all over India and other countries submit code on HackerEarth, solve problems and participate in online coding tests. Our CodeFactory server has processed over 500,000 requests till now. There are different types of challenges running every month. The technology stack consists of multiple servers of different types e.g. search-server, realtime-server, web-server, log-server, etc. running at any time. Over 100,000 lines of code are running to serve your requests, and we deploy a dozen times everyday.
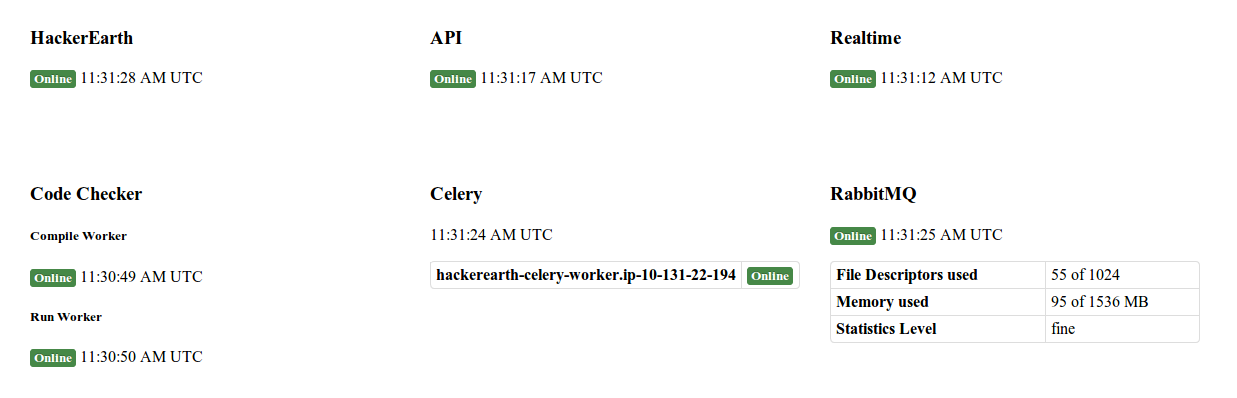
And we have been able to achieve that with relatively very high uptime all along. To make this possible, we have written many monitoring services for our backend. The public status page listing few of the services is now publicly available at http://status.hackerearth.com/.
To make it even more interesting, we are making the data collected by status monitoring services public. All the data is in JSON format, they are over 800,000 in number, and they are available in a schema-less database - RethinkDB. Are you curious how that data looks like? There might be gold-rush in there, and we invite you to find that gold, to find something interesting out of the data and show what you can do with that in hand. There are umpteen stories to uncover, you just need to dig!
###Data Access
The data is available in JSON format in RethinkDB. Following are the details of host, database and table:
- Endpoint: status-data-challenge.hackerearth.com
- Port: 80
- Database name: careerstack
- Tables
- hackerearth_status: for HackerEarth webserver
- api_status: for HackerEarth API
- realtime_status: for Realtime server
- code_checker_status: for CodeChecker server
- celery_status: for task queue
- rabbitmq_status: for message queue
- Web UI: http://status-data-challenge.hackerearth.com:8080/
To get started, you need to install rethinkdb-client drivers on your machine.
The query language is very simple and easy to get. You should go through RethinkDB QL for getting started with the database query.
Below is a sample Python code for reading hackerearth_status table:
import rethinkdb as r

# connect to rethinkdb
r.connect(host='status-data-challenge.hackerearth.com', db='careerstack', port=80).repl()

# get first 10 JSON data from hackerearth_status table
data = r.table('hackerearth_status').slice(0, 10).run()

for d in data:
    print d
It prints following output in the console:
{u'status': 200, u'response_received_time': 1374794680.909191, u'message': u'OK', u'request_time': 1374794680.889908, u'id': u'00004e52-2934-4446-850a-39414ab2e64e'}
{u'status': 200, u'response_received_time': 1375733282.5145938, u'message': u'OK', u'request_time': 1375733282.4913878, u'id': u'00019762-f0f7-4bf2-8a99-c9d6a148e647'}
{u'status': 200, u'response_received_time': 1374901211.485287, u'message': u'OK', u'request_time': 1374901211.444667, u'id': u'0003d0d1-b4fc-4efe-8bbb-566241bc19de'}
{u'status': 200, u'response_received_time': 1373712173.611913, u'message': u'OK', u'request_time': 1373712173.500822, u'id': u'0003e502-4a97-4214-9ebb-4264314c1523'}
{u'status': 200, u'response_received_time': 1376753907.3009229, u'message': u'OK', u'request_time': 1376753904.8444479, u'id': u'000608b2-529e-41de-956e-70b50ff8c585'}
{u'status': 200, u'response_received_time': 1374598010.706149, u'message': u'OK', u'request_time': 1374598008.899234, u'id': u'00078bfc-c9ac-4fce-a660-1a4bd6de6148'}
{u'status': 200, u'response_received_time': 1375150088.026571, u'message': u'OK', u'request_time': 1375150088.00546, u'id': u'000acc7f-f26d-499a-a395-d4c914fcf7c4'}
{u'status': 200, u'response_received_time': 1379057035.742864, u'message': u'OK', u'request_time': 1379057035.7246768, u'id': u'000b31df-9987-4f38-b0a9-61c659670317'}
{u'status': 200, u'response_received_time': 1374929387.17773, u'message': u'OK', u'request_time': 1374929387.126168, u'id': u'000b81e6-2e7e-491f-906a-c818c95a96f1'}
{u'status': 200, u'response_received_time': 1375804570.5828838, u'message': u'OK', u'request_time': 1375804570.4476259, u'id': u'000e3149-de7a-4b93-acb9-4eef5b030299'}
The data format varies a little for code_checker_status, celery_status, and rabbitmq_status. They have more key-value data in message.
You might have noticed, these are the following primary key-value pairs:
- id: Unique identifier for the JSON document
- status: Status code returned from the service
- message: Message returned from the service ping-pong
- request_time: Number of seconds since epoch when the service was pinged
- response_received_time: Number of seconds since epoch when the service responded
You might have realized that response_received_time - request_time is the service latency.
To see the data stored in code_checker_status table, copy-paste the following script in the Data Explore in Web UI and hit ‘Run’.
r.db('careerstack').table('code_checker_status').slice(0, 1)The data explorer and Web UI is completely exposed. This means anyone can delete the data too. But you are not advised to do so. In any case, the data is restored to original state every 10 minutes using a periodic asynchronous task.
Quering data is very easy and intuitive in RethinkDB in multiple languages. For creating visualizaton in the frontend, we recommend using d3js, a very good JavaScript library for creating graphs and other visualizations. You can read the basic tutorials here.
###To Enter Data Challenge
You have to host your code repository on Github and send a link to the repository along with images of your graph(s), table(s), or any other data analysis to vivek@hackerearth.com before midnight, October 13, 2013 IST.
###Prizes
We will vote on the favorite visualization and there will be a cash prize of $100 for the top entry. The winning entry will be featured in our blog. We will also send HackerEarth T-shirts to the next 5 entries. Winners will be announced in the week of October 21st, 2013.
Good luck with Gold rush!
Posted by Vivek Prakash. Follow me @vivekprakash. Write to me at vivek@hackerearth.com.