Logging millions of requests reliably with our new data ingestion pipeline
Introduction
HackerEarth handles millions of requests every day. To understand the user access patterns, get the usage of any particular feature or a page, figure out the daily active users or users who have been active for the past 6 months, etc in near real time, it is important to stream that data from across different services and ingest it to the analytics pipeline reliably.
Problem
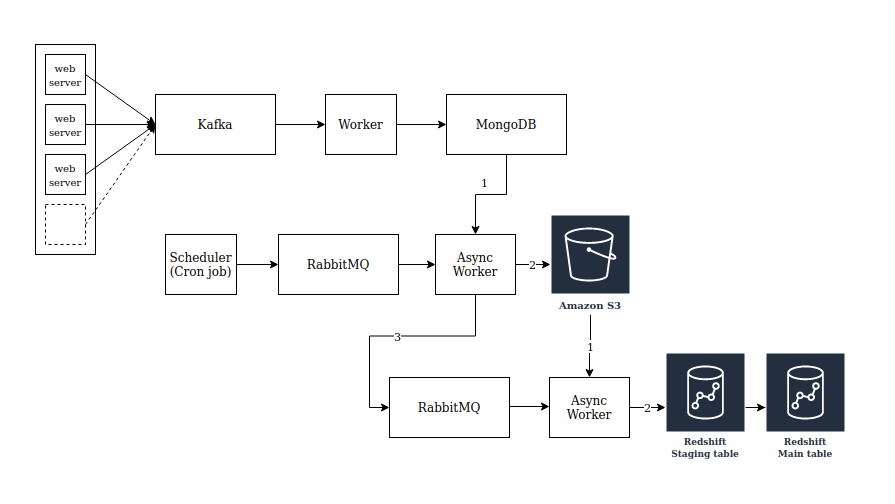
Our old request logging architecture was complex and has many moving components. There were a lot of operational overheads involved in maintaining and scaling each of those components independently to ensure that all the self-hosted components were up and running all the time.
Architecture
Solution
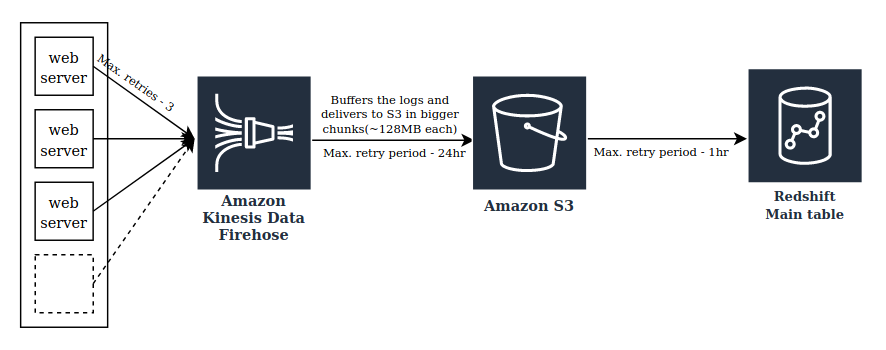
Last year, we revamped the way we log our web requests. It was done mainly to increase the reliability in logging the HTTP/HTTPS request data from across web services and also to reduce the operational overheads and the infrastructure cost associated with it. The new flow is making use of Kinesis Firehose data streams to deliver the request data from our web servers to Redshift (the database that we use to log and query request data) reliably with much lower cost. Amazon Kinesis Firehose is a fully managed service that automatically scales to match the throughput of our incoming request log data and requires no ongoing administration. It also allows us to compress and encrypt the data before loading it, minimizing the amount of storage used at the destination with increased security and we only need to pay for the amount of data we transmit through the service.
The new flow is a fully managed solution with almost no operational overhead. We tried to keep the flow simple and straightforward with less number of moving components. The request data is now guaranteed to appear in the Redshift table within 10-15 minutes from the point we received a request at our web server’s end. There are retries configured between consecutive infra components in the new flow to make sure there are no message drops in case of intermittent component failures/unavailability.
Architecture
Improvements
This pipeline worked flawlessly for more than a year logging a lot of request data to our Redshift servers. The size of our Redshift cluster had grown from a single node to a lot of nodes within a short period of time. This had a direct impact on our monthly AWS bill. We were forced to take a call to reduce the retention period of our request log data to keep the costs under control. We decided to keep only the last 12 months data at any given point. We started vacuuming the older data from Redshift periodically and were able to reduce the cluster size to around 2 to 3 nodes. However, over the next one year, the business grew significantly and hence grew the number of requests and its data size. In just 10 to 12 months, we ingested almost the same amount of data that we used to ingest in 1.5 - 2 years. That’s a lot of data to handle. Our Redshift cluster had grown to almost double its size again. It seemed unsustainable to us from the maintenance and the overall cost perspective to run that big of a Redshift cluster just to hold the request log data. The amount of request data available to our data analysts to query and analyze has gone down significantly from almost 3 years to just 1 year of data due to reduced retention period which is bad. Moreover, we were storing this request data at 2 different places, both the Redshift and S3. The S3 was acting as a backup.
Architecture
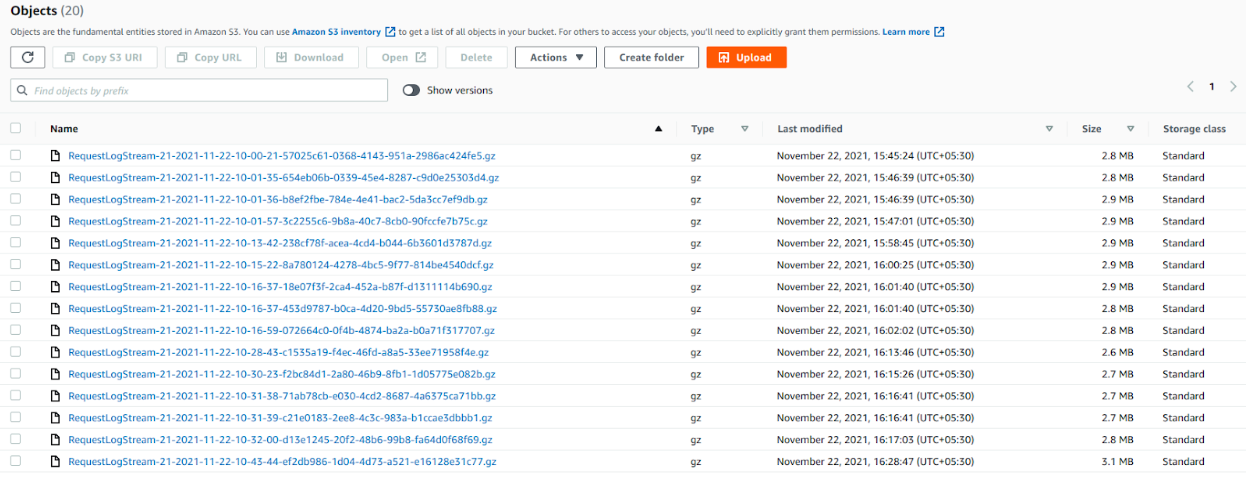
The data is getting segregated in the following way while the Firehose stream is writing it to S3. The S3 key prefix for each file would be in the format logs/yyyy/MM/dd/HH.

Following are the list of gzip compressed files that are getting stored every hour.
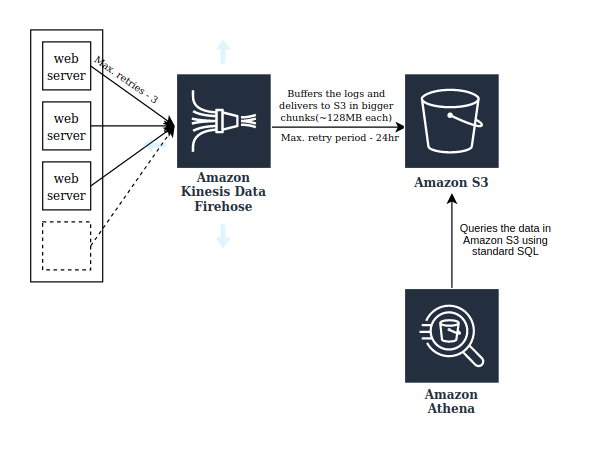
That’s when we started exploring alternate approaches to reduce the overall storage and compute costs while maximizing the data retention period. We wanted to see if there is a way to directly use the data in the S3 storage for our queries without having to load it in another on-demand datastore. And that’s exactly what AWS Athena does. It is an interactive query service that makes it easy to query and analyze data in Amazon S3 using standard SQL. Athena is serverless, so there is no infrastructure to manage, and we pay only for the queries that we run. Athena has the following functionalities:
- Scales automatically
- Running queries in parallel so results are fast, even with large datasets and complex queries
We quickly did a POC around this and pointed Athena to read data from the S3 bucket where we are logging our request data. It worked well but we observed that sometimes queries are taking too long to get processed and we figured out that it was happening mainly because Athena was trying to look into all the files we have and scanning the entire data everytime we run a query. We had lots of gzip files holding the request data for the past 3 years and the file count and the data size is only going to increase with time. Now, this has become a serious problem as it is going to scan TBs of data everytime we run a query and Athena charges $5 per every TB of data scanned!
After a quick search around the ways to address this problem, we realized that Athena has a support for data partitioning. By partitioning the data, we can restrict the amount of data scanned by each query, thus improving performance and reducing cost. Athena recently added a Partition projection feature that allows us to specify configuration information such as the patterns (for example, YYYY/MM/DD) that are commonly used to form partitions. This gives Athena the information necessary to build partitions without retrieving such metadata information from a remote metadata store. This reduces the runtime of queries against highly partitioned tables like ours since in-memory operations are often faster than remote operations.
Here is the sample SQL definition of the request log table that we have created in Athena.
CREATE EXTERNAL TABLE IF NOT EXISTS requestlog(
  accept_encoding STRING,
  http_accept_language STRING,
  http_host STRING,
  http_referer STRING,
  http_user_agent STRING,
  http_x_forwarded_for STRING,
  internal_reference BOOLEAN,
  is_ajax BOOLEAN,
  meta_queue_client STRING,
  path_info STRING,
  query_string STRING,
  remote_addr STRING,
  remote_host STRING,
  request_method STRING,
  request_scheme STRING,
  request_timestamp TIMESTAMP,
  request_uri STRING,
  server_addr STRING,
  server_name STRING,
  server_port STRING,
  site_hostname STRING,
  tracking_session_id STRING,
  user_id INT,
  session_id STRING,
  client_id STRING,
  landing_page STRING,
  timezone STRING)
PARTITIONED BY (datehour STRING)
ROW FORMAT serde 'org.apache.hive.hcatalog.data.JsonSerDe'
LOCATION 's3://mcs-request-logs/logs/'
TBLPROPERTIES
(
 'projection.enabled' = 'true',
 'projection.datehour.type' = 'date',
 'projection.datehour.range' = '2019/01/01/01,NOW',
 'projection.datehour.format' = 'yyyy/MM/dd/HH',
 'projection.datehour.interval' = '1',
 'projection.datehour.interval.unit' = 'HOURS',
 'storage.location.template' = 's3://mcs-request-logs/logs/${datehour}',
 'has_encrypted_data' = 'true'
)
Here, you can see that the minimum partition granularity we configured is 1 hour (refer to ‘projection.datehour.interval’ property) and the partition format (yyyy/MM/dd/HH) is the same as the directory structure in S3. And to take advantage of the data partitions, we need to use the ‘datehour’ field (dynamically projected column) in the WHERE clause of all queries we make. This will help us in significantly reducing the amount of data we are scanning per query. Athena supports a variety of compression formats including gzip (.gz) for reading data from S3. This enables us to store the request log data in a compressed format in S3 and thus minimizing the overall amount of data we are storing there.
In Athena, we can enforce cost controls by configuring data usage limits that apply to all queries running in an Athena workgroup. A workgroup is a logical grouping inside Athena that can be used to separate query execution and query history between users, teams, or applications running under the same AWS account. In a workgroup, we can set a limit on the amount of data scanned per-query, enforced on a running query. If a query crosses the configured threshold, Athena cancels the query. A workgroup allows us to set thresholds on the amount of data scanned on an hourly, or on a daily basis as well. This gave us full control over the maximum cost that we can incur per query.
Athena automatically stores query results and metadata information for each query that runs in S3 and keeps the query history for 45 days. It means during that 45 day period, if you try re-executing the query that was already executed, Athena will return the query result directly from S3, without actually executing it again. This helps us in improving the query performance and significantly reducing the amount of data scanned, especially when there are queries which run periodically (daily or weekly) with a good amount of intersection between the datehour ranges of consecutive queries, which are broken into smaller batches.
Implementation
Python client
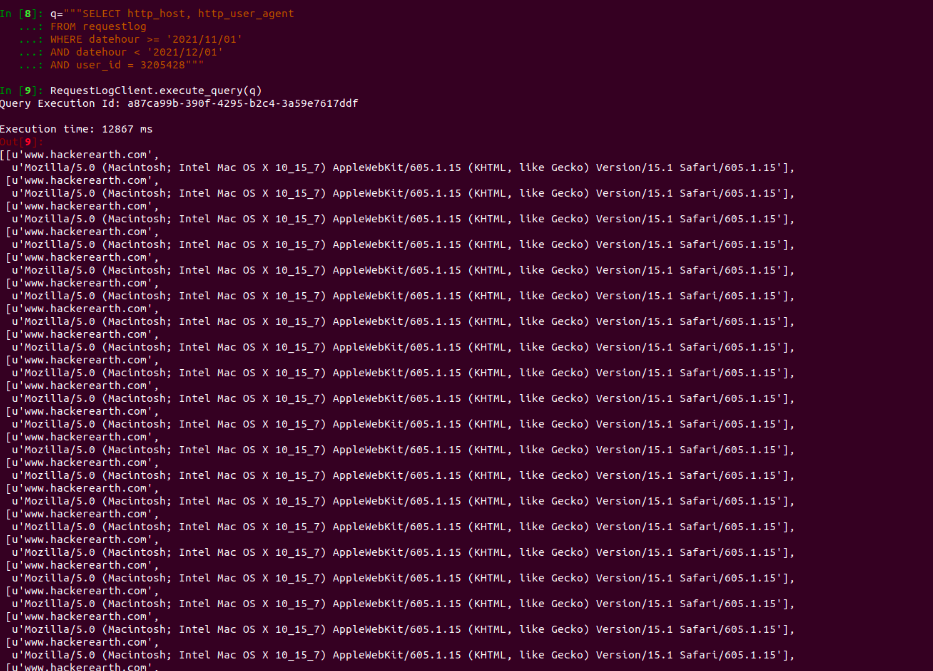
Here is the sample implementation of the Python client, on top of Athena, that we use to query our request log data.
class RequestLogClient:
    """
    Implements a client on top of Athena for querying request log data stored in S3
    """

    MAX_RETRY_INTERVAL = 10  # In seconds
    MAX_QUERY_WAIT_TIME = 30 * 60  # In seconds

    _database_name = "<athena database>"
    _workgroup = "<athena workgroup>"
    _athena_client = boto3.client("athena")

    @staticmethod
    def _get_query_hash(query):
        return hashlib.md5(query).hexdigest()

    @classmethod
    def _start_query_execution(cls, query):
        response = cls._athena_client.start_query_execution(
            QueryString=query,
            ClientRequestToken=cls._get_query_hash(query),
            QueryExecutionContext={
                'Database': cls._database_name
            },
            WorkGroup=cls._workgroup
        )
        logger.info("Query Execution Id: {}".format(
            response["QueryExecutionId"]))
        return response["QueryExecutionId"]

    @classmethod
    def _get_query_status(cls, query_execution_id):
        execution_time = None
        state_change_reason = None

        query_status = cls._athena_client.get_query_execution(
            QueryExecutionId=query_execution_id)
        query_exec = query_status["QueryExecution"]
        query_state = query_exec["Status"]["State"]

        if "StateChangeReason" in query_exec["Status"]:
            state_change_reason = query_exec["Status"]["StateChangeReason"]

        if "EngineExecutionTimeInMillis" in query_exec["Statistics"]:
            exec_time = query_exec["Statistics"]["EngineExecutionTimeInMillis"]

        return (query_state, state_change_reason, exec_time)

    @classmethod
    def _wait_for_result(cls, query_execution_id):
        total_wait_time = 0
        retry_interval = 1  # In seconds
        while total_wait_time <= cls.MAX_QUERY_WAIT_TIME:
            query_state, state_change_reason, exec_time = cls._get_query_status(
                query_execution_id)
            if query_state in ["SUCCEEDED"]:
                logger.info("Execution time: {} ms".format(exec_time))
                return None
            elif query_state in ["CANCELLED", "FAILED"]:
                error_string = "Query Execution Failed, Id: {}".format(
                    query_execution_id
                )
                raise RuntimeError(error_string)
            else:  # Either Queued or Running
                pass

            retry_interval = min((retry_interval * 2), cls.MAX_RETRY_INTERVAL)
            time.sleep(retry_interval)
            total_wait_time += retry_interval

        raise TimeoutError("The Athena is taking too long to process the query.")

    @staticmethod
    def _get_row_values(row):
        return [item['VarCharValue'] for item in row['Data']]

    @classmethod
    def _get_result(cls, query_execution_id):
        result = []
        next_token = None
        while next_token != "END":
            kwargs = {
                "QueryExecutionId": query_execution_id,
                "MaxResults": 1000
            }
            if next_token:
                kwargs.update({
                    "NextToken": next_token
                })
            response = cls._athena_client.get_query_results(**kwargs)
            next_token = response.get("NextToken", "END")
            result_data = response["ResultSet"]
            rows = result_data["Rows"]
            result_batch = [cls._get_row_values(row) for row in rows]
            result.extend(result_batch)
        return result[1:]

    @classmethod
    def execute_query(cls, query):
        query_execution_id = cls._start_query_execution(query)
        cls._wait_for_result(query_execution_id)
        result = cls._get_result(query_execution_id)
        return result
Conclusion
It is important to build a reliable, cost effective, and a fully-managed data ingestion pipeline because collecting data, analyzing it to get useful insights, and using those insights to drive the product growth, is crucial for any company to make informed decisions. At HackerEarth, we extract a lot of such insights from different kinds of data points, on a day-to-day basis. Request log is one such data source which we use to figure out a lot of different things, including common access patterns, user behavior, etc. If you are interested in working on projects like this and helping recruiters find the right talent they need, HackerEarth is hiring!
Posted by Jagannadh Vangala