Monitoring and alert system using Graphite and Cabot
Introduction
The infrastructure that powers a product and all of the services that it provides can be huge and complex because the product is scaled to serve millions of users. In most cases, each service might depend on various components for seamless functioning. With a product that houses a variety of features with critical infrastructure components and services powering these features, it becomes vital to monitor these components and services and keep them running at any cost.
This monitoring system has to handle the following:
- Gathering data from all the components and services
- Storing the data efficiently and in an easily accessible manner
- Visualizing the data for faster comprehension
- Making sense of this data and relaying alerts to the respective owners of the services and components
- Managing the on call team and alerting them immediately
At HackerEarth…
Initially when we began facing problems because of some of our machines and services going down, we wrote ad hoc monitoring scripts that ran as crons to send email alerts. We also set up AWS Cloudwatch alarms to send notifications via email. There came a time when we had a very high number of components to be monitored and we realised that we were not getting enough insight into the load and usage of our machines. This is when we decided to put a system in place to collect data from these monitors and services. We also added a monitoring component to send alerts in more reliable ways (through phone calls) to the product owners and our on-call team, in case of any downtime.
Components of this system
This system consists of the following components that work together,
- Collection: Tool for collecting metrics from all the infrastructure components
- Forwarding: Tool for aggregating the metrics that are recieved from various machines and services and routing it to different storage backends
- Visualization: Tool for generating graphs and visualizing metrics
- APIs: Backend that provides APIs to query the metrics data for dashboards and alerting systems
- Storage backends: Database for storing the time-series metrics data
- Monitoring: Monitoring system for performing checks on the metrics and sending alert notifications
There are a lot of tools out there for each of these components that can be put together to build this system rather than writing it from the scratch. We were very happy with what Cabot had to offer as a monitoring and alert system. Since it used Graphite APIs for the monitoring checks, we decided to use Graphite to record and serve all our metrics.
Traditional approach
Graphite is usually used with the following components at its core:
- Carbon as a forwarding/relaying component
- Graphite-Web as a web and API component
- Whisper as a library for storing time-series data with MySQL or PostgreSQL as the database
- Grafana for visualization and any tool like collectd or statsd as a metric collector
Limitations
While these are useful, there are many issues that surface as you try to scale this system, Some of the major limitations seen with this approach include:
- Carbon is written in Python, and cannot scale to millions of metrics that are being reported to it. It starts dropping metrics when it is unable handle the load
- Using databases like MySQL and PostgreSQL for storing time-series data is not efficient. Graphs on Grafana start rendering very slowly. Its understandable as these databases were not built for time-series data

Influx to the rescue!
InfluxDB is a database that is written in Go, primarily for time-series metric data. This database is by far the best option for a database to be used with Graphite. We also found alternative components for:
- Using the API with InfluxDB as a storage component
- Mitigating the limitations of using Graphite with the components mentioned above
The components that we found to be better include:
- Collectd: This is the collection component that will collect metrics from all the machines
- carbon-relay-ng: This is a carbon that is written in Go. It can scale to 2500 metrics/s or 150k minutely. It is used for forwarding the metrics to InfluxDB which has a graphite listener to receive the data in the Graphite format
- InfluxDB serves as a kickass backend to store the metrics data!
- Grafana: This has the capability of adding InfluxDB as a data source and helps in creating and rendering graphs effortlessly
- graphite-api: This is the API component. It is the APIs in graphite-web without the web interface and is much lighter. It uses InfluxGraph as a storage backend.
- Cabot: This is the monitoring component that conducts periodic checks on the metrics in InfluxDB using the graphite-api and sends alerts.

Putting these components together
Collectd
Collectd is used for the metrics-collection component. You can get collectd from here. Collectd provides a lot of plugins for collecting various metrics. Some important plugins to look at are CPU, memory, and disk. It also provides plugins for other tools like MySQL, Redis, PostgreSQL and amqp.
Custom metrics can be reported to carbon-relay-ng using the Python plugin that runs a Python script to collect metrics. This is an example of writing custom-service plugins (in Python) that are used by collectd. Most importantly the write_graphite plugin is used to report metrics to carbon-relay-ng in the graphite line format.
This is the format of the write_graphite plugin that should be added in the collectd config file
<Plugin write_graphite>
    <Node "graphite">
        Host "<carbon-server-ip>"
        Port "<carbon-server-port>"
        Protocol "tcp"
        LogSendErrors true
        Prefix "random_prefix."
        StoreRates true
        AlwaysAppendDS false
        EscapeCharacter "_"
    </Node>
</Plugin>

# Important: You must use the right prefix. If it does not match with
# any of the carbon routes that have been configured, then carbon-relay-ng will
# drop the metrics.
The intervals in which collectd sends metrics is configured a the global level in the config file for all the plugins by using the Interval parameter. It can be specified inside each plugin to override the interval for that plugin.
Collectd is one of the tools that is used to report metrics. Many other tools can be used to report metrics to graphite with this architecture. Some alternatives can be found here.
Carbon Relay Ng
You can install carbon-relay-ng from here. The following points have to be kept in mind while using it:
- The conf file in /etc/carbon-relay-ng/carbon-relay-ng.conf has the params spool-dir and pid-file. In case of errors due to these parameters, set them to /var/spool/carbon-relay-ng and /var/run/carbon-relay-ng.pid. Create the directory in spool, if required.
- It supports routing to various sources by creating routes in the config file. For more information, read the documentation.
- It allows the blacklisting of metrics based on the prefix, regex, or substring match.
- It provides aggregators to batch metrics for an interval and applies aggregation functions on the values. The aggregated value is then routed to the destination.
- It also allows rewriters to rewrite metric names.
- It comes with a UI where new routes can be added during runtime.
Sample Route
Format : addRoute <type> <key> [opts]   <dest>  [<dest>[...]]
'addRoute sendAllMatch collectd  127.0.0.1:2005 prefix=hemetrics'
Multiple such routes can be added to the init list in the config file. Here the command addRoute adds a new route of the type sendAllMatch, which sends metrics to all destinations that match! Metrics can be matched by using prefixes, substring, or regex matches.
In this case the route has the key collectd and sends metric data with the prefix hemetrics to all matching destinations where the destination is expected to be a TCP endpoint (IP:port combination).
Carbon or carbon-relay-ng in our case, can be fed externally too by using the line-text protocol. For more information, read the relevant documentation here.
carbon-relay-ng provides a lot more options for matching and transforming data. For more information, read the documentation. :)
InfluxDB
InlfuxDB is a very good choice for storing our metrics data as it is a time-series database and has a very high performance (written in Go). Some of the other features that make InfluxDB awesome:
- Supports mutilple protocols for data ingestion including Graphite
- Has a query language that is very SQL-like
- Allows tagging of data which is indexed thus making queries efficient
- Provides retention policies to automatically expire data
- Has a built in web interface
- Provides continuous queries that automatically aggregate data making frequent queries faster
# Config for the graphite listener
[[graphite]]
  # Determines whether the graphite endpoint is enabled.
  enabled = true
  database = "graphite"
  # This is what the carbon-relay-ng route should use as the destination
  bind-address = "localhost:2005"
  protocol = "tcp"
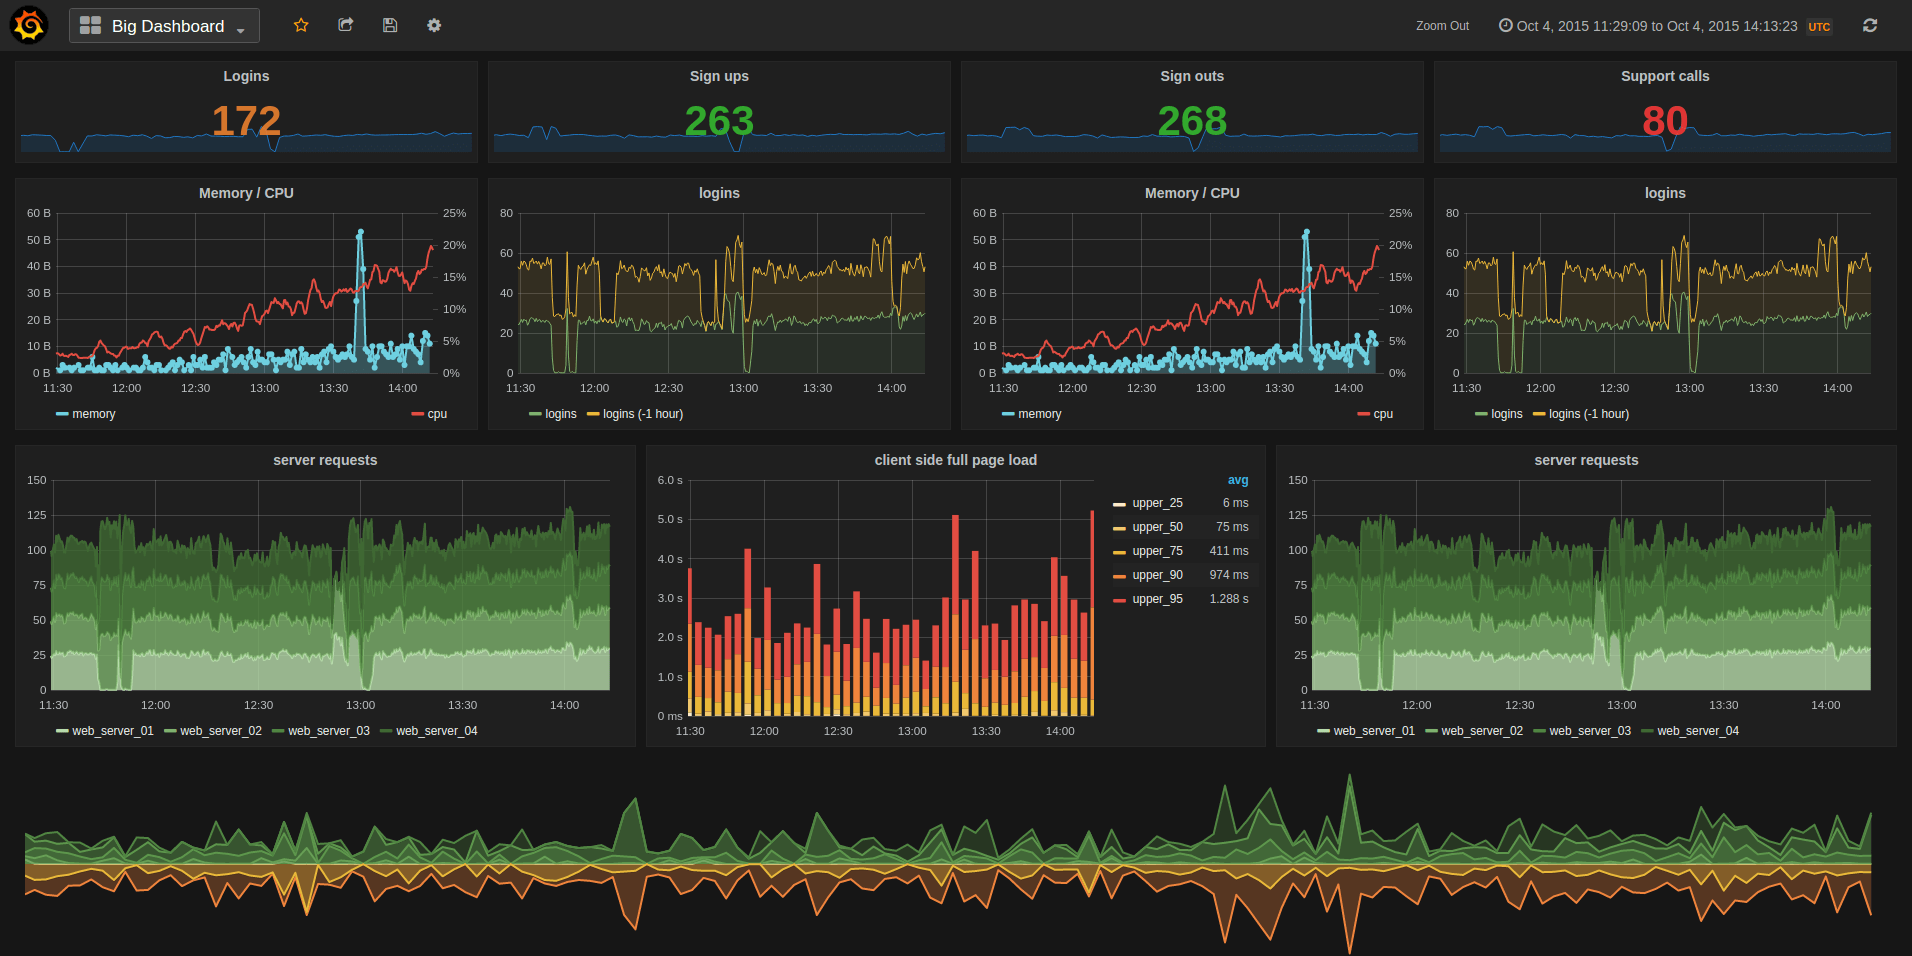
Grafana
Grafana as a visualization component, provides a plethora of options like histograms, heat maps, and graphs. Grafana provides alerting options and notifications on alerts to PagerDuty, Slack, and a few other services. However, since we wanted something more than that we decided to deploy Cabot as the monitoring and alerting component.
Grafana enables us to create beautiful dashboards and renders it seamlessly for the on-call team to monitor various components in a single dashboard. Installing grafana and creating dashboards is a cakewalk. Start creating your dashboards here.
Graphite API & Influx Graph
Graphite-API is grahpite-web with just the HTTP APIs and not the web interface. It implements most of the APIs. To make Graphite-API use InfluxDB as the datasource, install Influx Graph (storage plugin for Graphite-API).
The configuration for Graphite-API resides in /etc/graphite-api.yaml. An example for it can be found here
Installing Influx Graph installs Graphite-API and a lot more dependencies including InfluxDB. Graphite-API provides a lot of configuration options for using standard templates for queries, caching queries in memcache, aggregation functions, and grouping data bases on intervals combined with query-retention policies to cache queries of certain intervals for specific amounts of time.
When templates are added, the API expects queries for the metrics of the format that is specified in these templates only. Any other queries will return zero results.
Graphite-API can be deployed in various ways. At HackerEarth we have deployed it using NGINX and uWSGI.
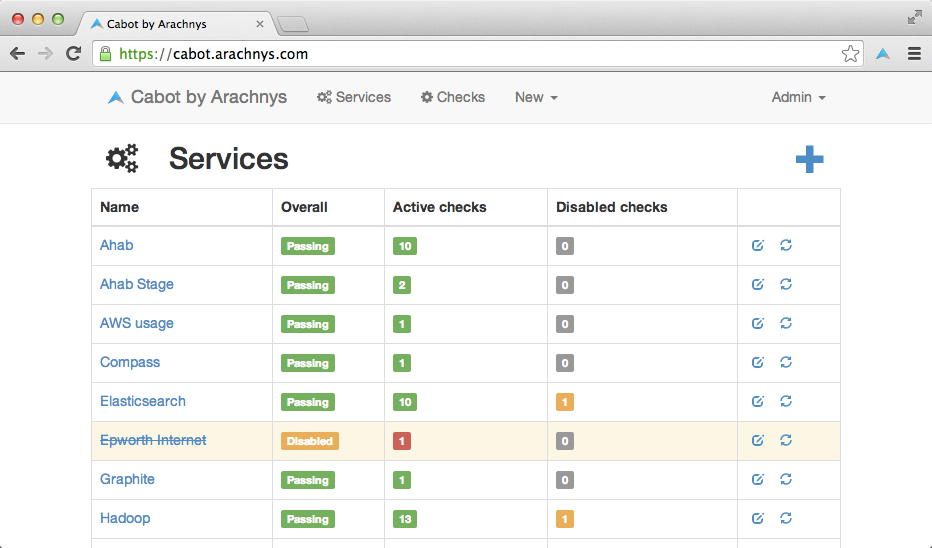
Cabot
Cabot is an open-source monitoring and alert system written in Python and Django. It provides the best features of PagerDuty free of cost.
The documentation is pretty good for setting it up and getting it work without any hassles. Some of the best features of Cabot include:
- Web interface to configure services, checksi, and users
- Good coupling of services, checks, and users. This allows certain default users to be notified for every service.
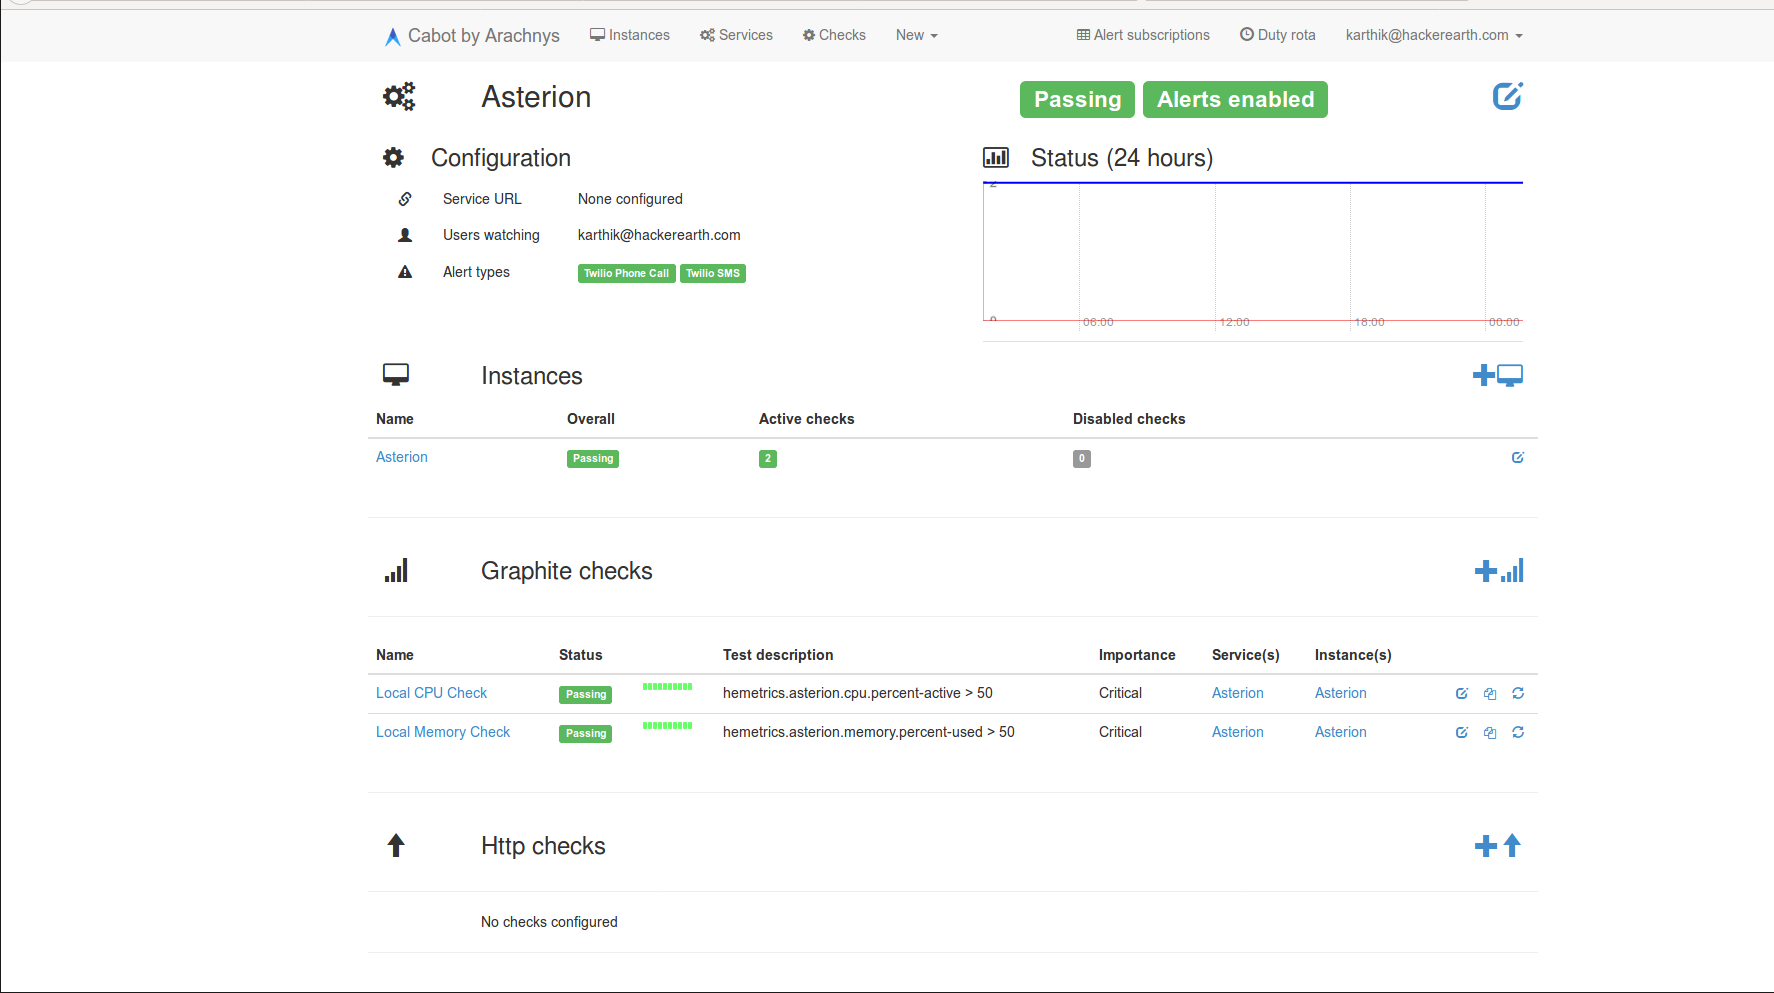
- Checks that include graphite metric checks, jenkins job checks, and http endpoint checks.
- Alerts sent through email, Hipchat, Slack, phone and SMS (Twilio).
- Recovery instructions can be tagged with every check
- Easy integration of custom alerts.
- On-call management, users on call are picked up from a Google Calendar and updated every half hour.
- Easy deployment
All of the cabot configuration options can be found here.
Note: Cabot uses Celery to run all the service check tasks. The configuration parameter CELERY_BROKER_URL requires a redis host with the right authentication. Also set the WWW_HTTP_HOST to the FQDN of the server.
Check if all the checks are running by visiting /status/ endpoint.
Complete workflow

Final words
It has been two months since we started using this system at HackerEarth. It has been very stable and completely reliable. We collect hundreds of metrics from various machines and services every minute. This has given us a better understanding of the load on our critical machines and services, thus helping us manage our infrastruture more efficiently and minimising our downtime.
Posted by Karthik Srivatsa