Logging millions of requests everyday and what it takes
HackerEarth’s web servers handle millions of requests every day. These request logs can be analyzed to mine some highly useful insights as well as metrics critical for the business, for example, no. of views per day, no. of views per sub product, most popular user navigation flow etc.
Initial Thoughts
HackerEarth uses Django as its primary web development framework and a host of other components which have been customized for performance and scalability. During normal operations, our servers handle 80-90 requests/sec on an average and this surges to 200-250 requests/sec when multiple contests overlap in a time delta. We needed a system which could easily scale to a peak traffic 500 requests/sec. Also, this system should add minimum processing overhead to the webservers and the data collected should be stored for crunching and offline processing.
Architecture
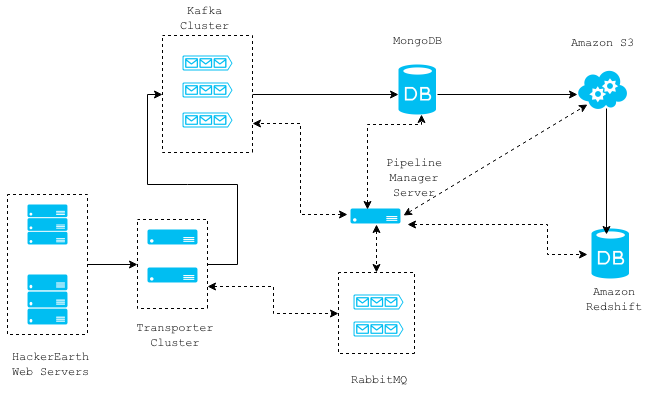
The diagram above shows a high level architecture of our request log collection system. The solid connection lines represent the data flow between different components and the dotted lines represent the communications. The whole architecture is message based and stateless and so individual components can easily be removed/replaced without any downtime.
Below is a more detailed explanation about each component in the order of data flow.
Web Servers
On the web servers, we employ a Django Middleware that asynchronously retrieves required data for a given request and then forwards it to the Transporter Cluster servers. This is done using a thread and the middleware adds an overhead of 2 milli seconds to the Django request/response cycle.
class RequestLoggerMiddleware(object):
    """
    Logs data from requests
    """
    def process_request(self, request):
        if settings.LOCAL or settings.DEBUG:
            return None

        if request.is_ajax():
            is_ajax = True
        request.META['IS_AJAX'] = is_ajax

        before = datetime.datetime.now()

        DISALLOWED_USER_AGENTS = ["ELB-HealthChecker/1.0"]


        http_user_agent = request.environ.get('HTTP_USER_AGENT','')

        if http_user_agent in DISALLOWED_USER_AGENTS:
            return None

        # this creates a thread which collects required data and forwards
        # it to the transporter cluster
        run_async(log_request_async, request)
        after = datetime.datetime.now()

        log("TotalTimeTakenByMiddleware %s"%((after-before).total_seconds()))
        return None
Transporter Cluster
The transporter cluster is an array of Non Blocking Thrift servers for the sole purpose of receiving data from the web servers and routing them to any other component like MongoDB, RabbitMQ, Kafka etc. Where a given message should be routed to is specified in the message itself from the webservers. There is only one way communication from webservers to the transporter servers and this saves some time resource spent in the acknowledgement of the message reception by thrift servers. We may lose some request logs due to this but we can afford to do so. The request logs are currently routed to the Kafka cluster. The communication between the webservers and the transporter servers takes 1-2 milli seconds on an average and can be horizontally scaled to handle an increase in load.
Following is a part of the thrift config file. The file defines a DataTransporter service supporting a method with oneway as a modifier which basically means that the RPC call will return immedeiately.
service DataTransporter {
    oneway void transport(1:map<string, string> message)
}
Kafka Cluster
Kafka is a high throughput distributed messaging system that supports publish/subscribe messaging pattern. This messaging infrastructure enables us to build other pipelines that depend upon this stream of request logs. Our Kafka cluster stores last 15 days worth of logs and so we can make any new consumer that we implement start processing data 15 days back in time.
Useful reference for setting up a kafka cluster.
Pipeline Manager Server
This server manages the consumption of request log messages from the Kafka topics, storing them in MongoDB and then later moving them to Amazon S3 as well as Amazon Redshift. MongoDB acts merely as a staging area for the data consumed from the Kafka topics and this data is transferred to S3 at hourly intervals. Every file that is saved in S3 is loaded into Amazon Redshift which is a data warehouse solution that can scale to petabytes of data. We use Amazon Redshift for analyzing/metrics calculation from request log data. This server works in conjunction with a RabbitMQ cluster which it uses to communicate about task completion and initiation.
Here is the script that loads data from S3 into Redshift. This script handles insertion of duplicate data first by removing any duplicate rows and then inserting the new data.
import os
import sys
import subprocess

from django.conf import settings


def load_s3_delta_into_redshift(s3_delta_file_path):
    """s3_delta_file_path is path after the bucket
    name.
    """
    bigdata_bucket = settings.BIGDATA_S3_BUCKET

    attrs = {
        'bigdata_bucket': bigdata_bucket,
        's3_delta_file_path': s3_delta_file_path,
    }

    complete_delta_file_path = "s3://{bigdata_bucket}/{s3_delta_file_path}".format(**attrs)

    schema_file_path = "s3://{bigdata_bucket}/request_log/s3_col_schema.json".format(**attrs)

    data = {
            'AWS_ACCESS_KEY_ID': settings.AWS_ACCESS_KEY_ID,
            'AWS_SECRET_ACCESS_KEY': settings.AWS_SECRET_ACCESS_KEY,
            'LOG_FILE':  complete_delta_file_path,
            'schema_file_path': schema_file_path
          }

    S3_REDSHIFT_COPY_COMMAND = " ".join([
        "copy requestlog_staging from '{LOG_FILE}' ",
        "CREDENTIALS 'aws_access_key_id={AWS_ACCESS_KEY_ID};aws_secret_access_key={AWS_SECRET_ACCESS_KEY}'",
        "json '{schema_file_path}';"
    ]).format(**data)


    LOADDATA_COMMAND = " ".join([
        "begin transaction;",
        "create temp table if not exists requestlog_staging(like requestlog);",
        S3_REDSHIFT_COPY_COMMAND,
        'delete from requestlog using requestlog_staging where requestlog.row_id=requestlog_staging.row_id;',
        'insert into requestlog select * from requestlog_staging;',
        "drop table requestlog_staging;",
        'end transaction;'
        #'vacuum;' #sorts new data added
    ])

    redshift_conn_args = {
        'host': settings.REDSHIFT_HOST,
        'port': settings.REDSHIFT_PORT,
        'username': settings.REDSHIFT_DB_USERNAME
    }

    REDSHIFT_CONNECT_CMD = 'psql -U {username} -h {host} -p {port}'.format(**redshift_conn_args)

    PSQL_LOADDATA_CMD = '%s -c "%s"'%(REDSHIFT_CONNECT_CMD, LOADDATA_COMMAND)

    returncode = subprocess.call(PSQL_LOADDATA_CMD, shell=True)
    if returncode !=0:
        raise Exception("Unable to load s3 delta file into redshift ",
                s3_delta_file_path)
What’s next
Data is like gold for any web application. The insights that it can provide and growth it can drive is amazing, if done the right way. There are dozens of features and insights that can be built with the requests logs, including recommendation engine, better content delivery, and improving the overall product. All of this is a step towards making HackerEarth better each & every day for our users.
If you have any queries or wish to talk more about this architecture or any of the technologies involved, you can mail me at praveen@hackerearth.com.
Posted by Praveen Kumar.